Non-profit organizations in rural Canada, 2019

In 2019, there were over 130,000 non-profit organizations (NPOs) in Canada, of which, nearly one quarter (22.5%) were in rural Canada. Rural NPOs employed just over one tenth (11.6%) of all non-profit employees and were responsible for 7.3% of revenues generated.
The release of the Rural Canada Non-Profits, 2019, database provides a new perspective on the activities of NPOs in rural Canada. NPOs play an important role in the well-being of Canadians in both rural and urban communities. The RCNP database defines NPOs as organizations that operate for a purpose other than profit. Types of NPOs within the database include social, recreational, or hobby groups, certain amateur sports organizations, certain festival organizations, and charities. The RCNP database provides data for 2019, broken down by various geographical levels, International Classification of Non-Profit Organization (ICNPO) activity groups, and North American Industry Classification System codes.
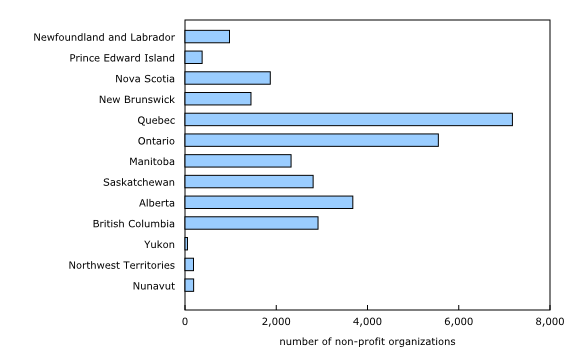
Over half of all rural non-profit organizations were in Quebec, Ontario, and Alberta
Canada had nearly 30,000 rural NPOs in 2019. Quebec (7,176), Ontario (5,553), and Alberta (3,678) had the most rural NPOs of all provinces and territories, accounting for 55.5% of all rural non-profits. The three territories had the fewest number of rural NPOs at 429, collectively.
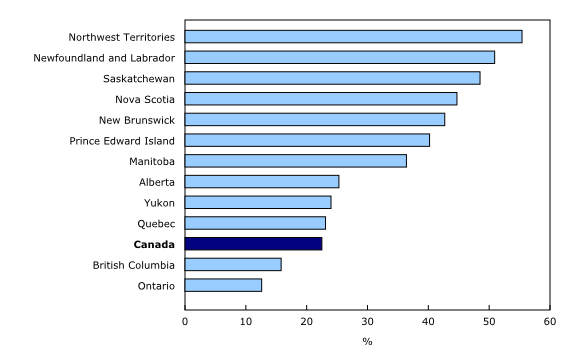
The majority of non-profit organizations in the Northwest Territories and Newfoundland and Labrador were in rural areas
Over half of non-profits in the Northwest Territories (55.4%) and Newfoundland and Labrador (50.9%) were in rural areas in 2019. Only Ontario (12.6%) and British Columbia (15.8%) had a rural percentage of NPOs that was below the national average of 22.5%. In Quebec, the province with the most rural NPOs, 23.1% of non-profits were in rural areas.
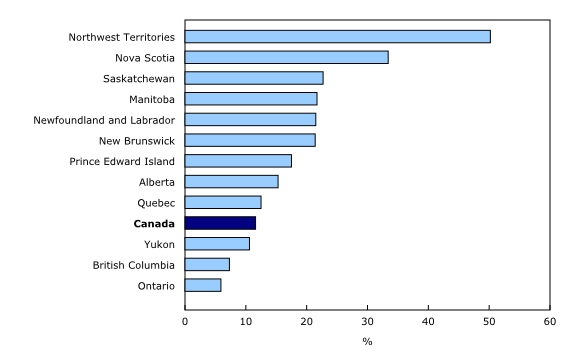
Ontario, British Columbia, and Yukon had a lower percentage of rural non-profit organization employees than the national average
Rural NPOs in Canada had 11.6% of all NPO employees, while this share varied by over 40 percentage points among the provinces and territories. Rural NPO employees made up 12.5% of all NPO employees in Quebec, the province with the greatest number of non-profit employees. The Northwest Territories had the highest rural share of non-profit employees at half (50.2%) of all NPO staff in that territory, followed by Nova Scotia (33.4%) and Saskatchewan (22.7%). In contrast, the lowest rural share of NPO employees within a province or territory was in Ontario (5.9%), followed by British Columbia (7.3%) and Yukon (10.6%).
Over one quarter of non-profit organization revenues in four provinces and territories were generated by rural non-profits
Ontario reported the highest overall NPO revenues in 2019, while the rural share of these revenues was the lowest of the provinces and territories at 3.8%. Rural contributions to a province's or territory's total NPO revenue were next lowest in Yukon (4.1%) and British Columbia (4.9%). Non-profits in rural areas contributed over 25% of all NPO revenues in the Northwest Territories (51.0%), New Brunswick (29.3%), Newfoundland and Labrador (25.8%), and Nova Scotia (25.3%).
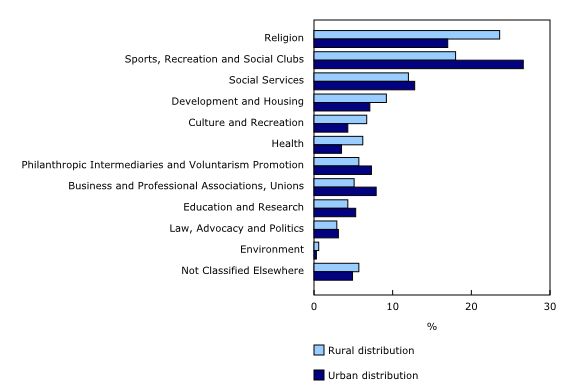
Religion; sports, recreation and social clubs; and social services were the three most common non-profit organization activities in rural Canada
In 2019, nearly one quarter (23.6%) of rural NPOs were active in religion, followed by sports, recreation and social clubs (18.0%) and social services (12.0%). In urban Canada, the largest shares of NPOs worked in sports, recreation and social clubs (26.6%); religion (17.0%); and social services (12.8%). The top three activities for rural and urban non-profits accounted for 53.6% of rural NPOs and 56.4% of urban NPOs.
Chart 1 
Counts of rural non-profit organizations by province or territory, 2019
Chart 2 
Rural share of non-profit organizations within a province or territory, by counts of non-profit organizations, by province or territory, 2019
Chart 3 
Rural share of non-profit organization employees within a province or territory, by province or territory, 2019
Chart 4 
Rural share of non-profit organization revenue within a province or territory, by province or territory, 2019
Chart 5 
Rural and urban non-profit organization count distribution across Canada, by International Classification of Non-Profit Organization activity, 2019
Products
The database "Rural Canada Non-Profits, 2019," is now available.
The infographic "Non-profit organizations: A rural perspective, 2019," which is part of Statistics Canada – Infographics (Catalogue number11-627-M), is now available.
Contact information
For more information, or to enquire about the concepts, methods or data quality of this release, contact us (toll-free 1-800-263-1136; 514-283-8300; infostats@statcan.gc.ca) or Media Relations (statcan.mediahotline-ligneinfomedias.statcan@statcan.gc.ca).
-
Date
Sep 20, 2022
-
By
Statistics Canada
Newsletter
Sign up for the Healthy Aging CORE BC e-news to keep up-to-date with activity from the platform and the Community-Based Seniors Services (CBSS) sector across the country.


